
Troubleshooting Secure Mesh Site v2 deployments
Overview
Use this guide to troubleshoot the Distributed Cloud Secure Mesh Site v2 for registration, provisioning, and other common issues.
About the Secure Mesh Site v2
The new Secure Mesh Site v2 Customer Edge (CE) deployment process is streamlined for all provider environments. The goal is to help you seamlessly deploy the nodes for any provider or environment. This new deployment process provides you with all the information needed to bootstrap the node(s) and register the node(s) with Distributed Cloud Console.
Before you begin
Before you begin, verify that you have:
-
A Distributed Cloud account. If you don't have an account, see Get Started with Distributed Cloud Console.
-
CPU and RAM resources listed in the Customer Edge Site Sizing Reference.
-
Read the documentation for Secure Mesh Site v2 and the provider-specific documentation.
-
Public Internet access for the Site Local Outside (SLO) interface.
-
Verified that the CE node(s) can access the F5 registration or proxy endpoint on the SLO interface. You can find the registration endpoint info by entering the generated site token into any JWT decoder, such as jwt.io.
-
Verified that the CE node(s) can access the public IP addresses of F5 Regional Edges (REs) through the SLO interface referenced at Firewall and Proxy Server Allowlist Reference.
-
Ensured that mandatory information (such as token, DNS, SLO IP, gateway, and more) is accurate semantically as mentioned in the how-to deployment guides for your provider.
-
Checked the validity of the token using any JWT decoder, such as jwt.io. Create a new token if the old token is expired. Tokens checked out from the Distributed Cloud Console are valid for seven days.
Troubleshooting tools for registration and provisioning
Site dashboard tools
This section introduces the tools that are used to troubleshoot the different scenarios. The Distributed Cloud Site dashboard has a per-site tools section that can be used to troubleshoot site nodes.
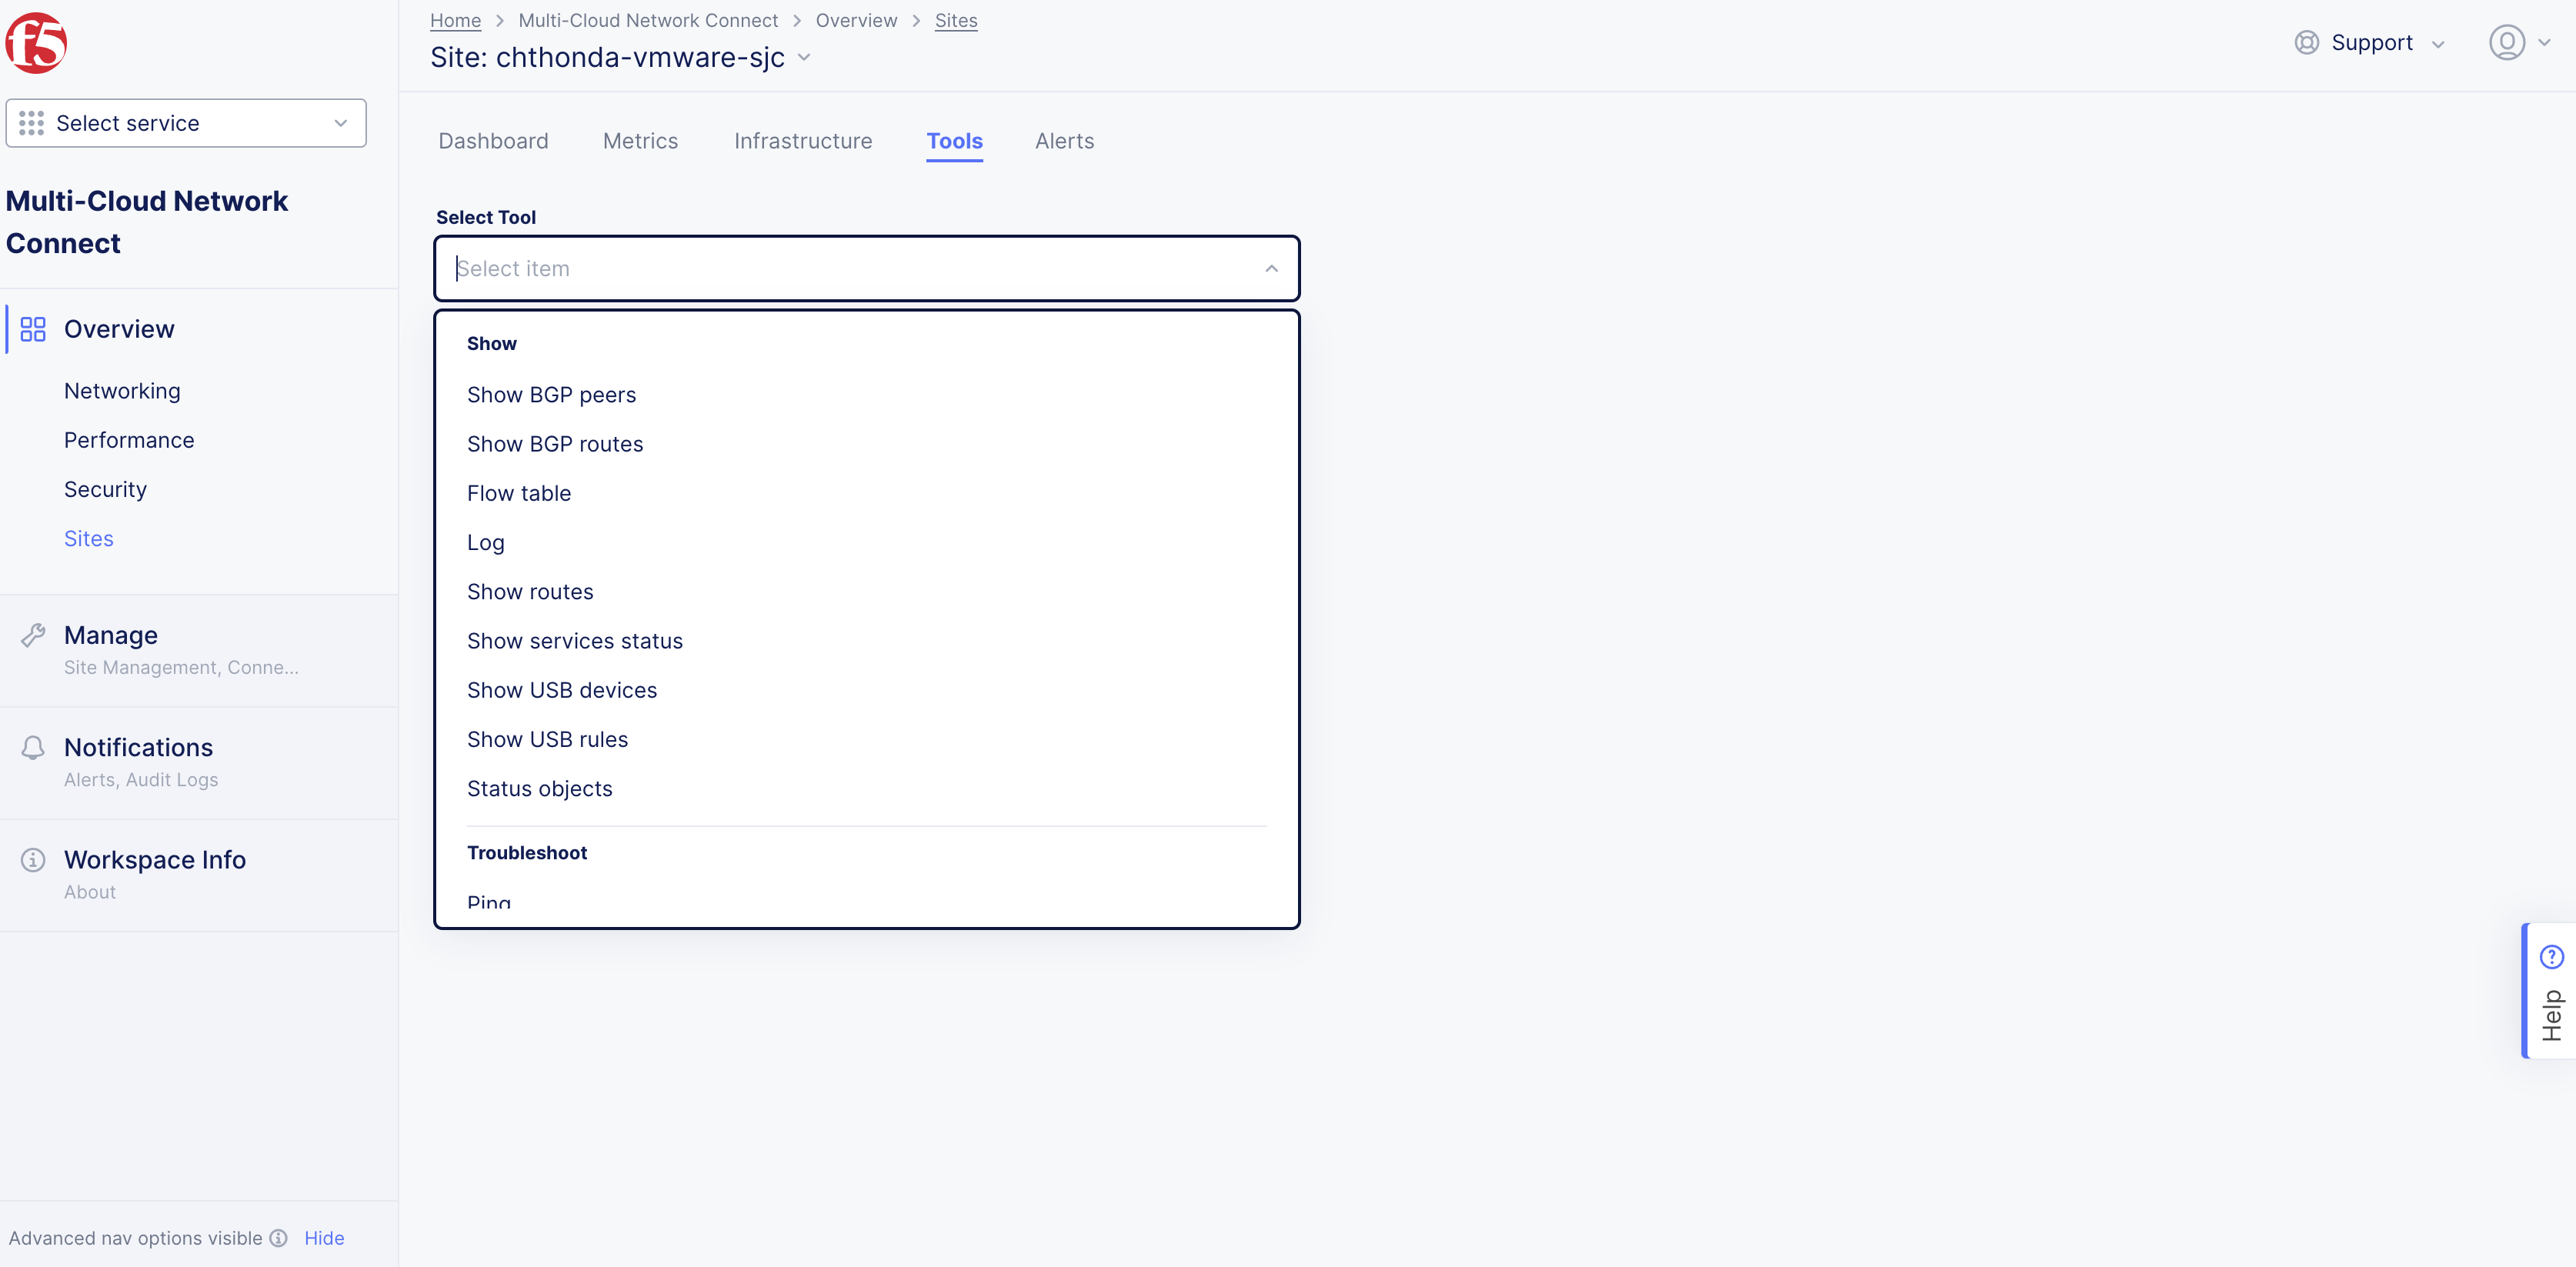
Figure: Site troubleshooting tools
These UI tools only work when the site is connected to F5 Distributed Cloud. During the pre-connectivity phase, F5 recommends that you directly connect to the node with Site CLI, which you can access with SSH, VNC, or console (depending on the environment).
Node Site CLI tools
Site CLI is a command-line interface (CLI) tool available directly on the node. Log in to the node with Distributed Cloud Console. After you're logged in, there are several commands, like health and diagnosis to troubleshoot the node. Authentication requires a custom password if one has been configured. Otherwise, use the default password: Volterra123.
For public cloud providers, the default username is admin. Authentication can be done using an SSH key or a custom password, which you can configure from Distributed Cloud Console.
For non-cloud providers, the default username is admin and the password is Volterra123.
Observe node VPM status and logs
VPM (Volterra Platform Manager) is an agent on the node providing configuration of services (Kubernetes and F5 Distributed Cloud services) and operating system. As the main software component of the node software, it is responsible for node provisioning. Observing and analyzing the VPM logs is critical to identifying the root cause of a problem.
Check VPM status
To check VPM status, use the following command from the Site CLI:
execcli systemctl-status-vpmTo check software, OS, cluster, registry connectivity, and other useful troubleshooting info, use the following command:
status vpmTo check VPM status for CEs deployed on Kubernetes, use the following command:
kubectl exec -it vp-manager-0 -n ves-system -- vpmuObserve VPM logs
Access the VPM logs using two methods: Site CLI and Distributed Cloud Console.
execcli journalctl -fu vpmUse your browser to connect to the node. Note that port 65500 needs to be open to connect to the site local UI. For example, https://[node IP]:65500. Navigate to Dashboard > Tools > Show Log > Volterra Platform Manager.
Common registration failure scenarios during deployment
This section details registration failure scenarios and corresponding troubleshooting steps you can perform during CE deployment: The registration and provisioning phases. You can identify this class of failures by observing the site's status as Waiting for Registration. In this case, we can assume that node was created but no change for the Site Admin State.
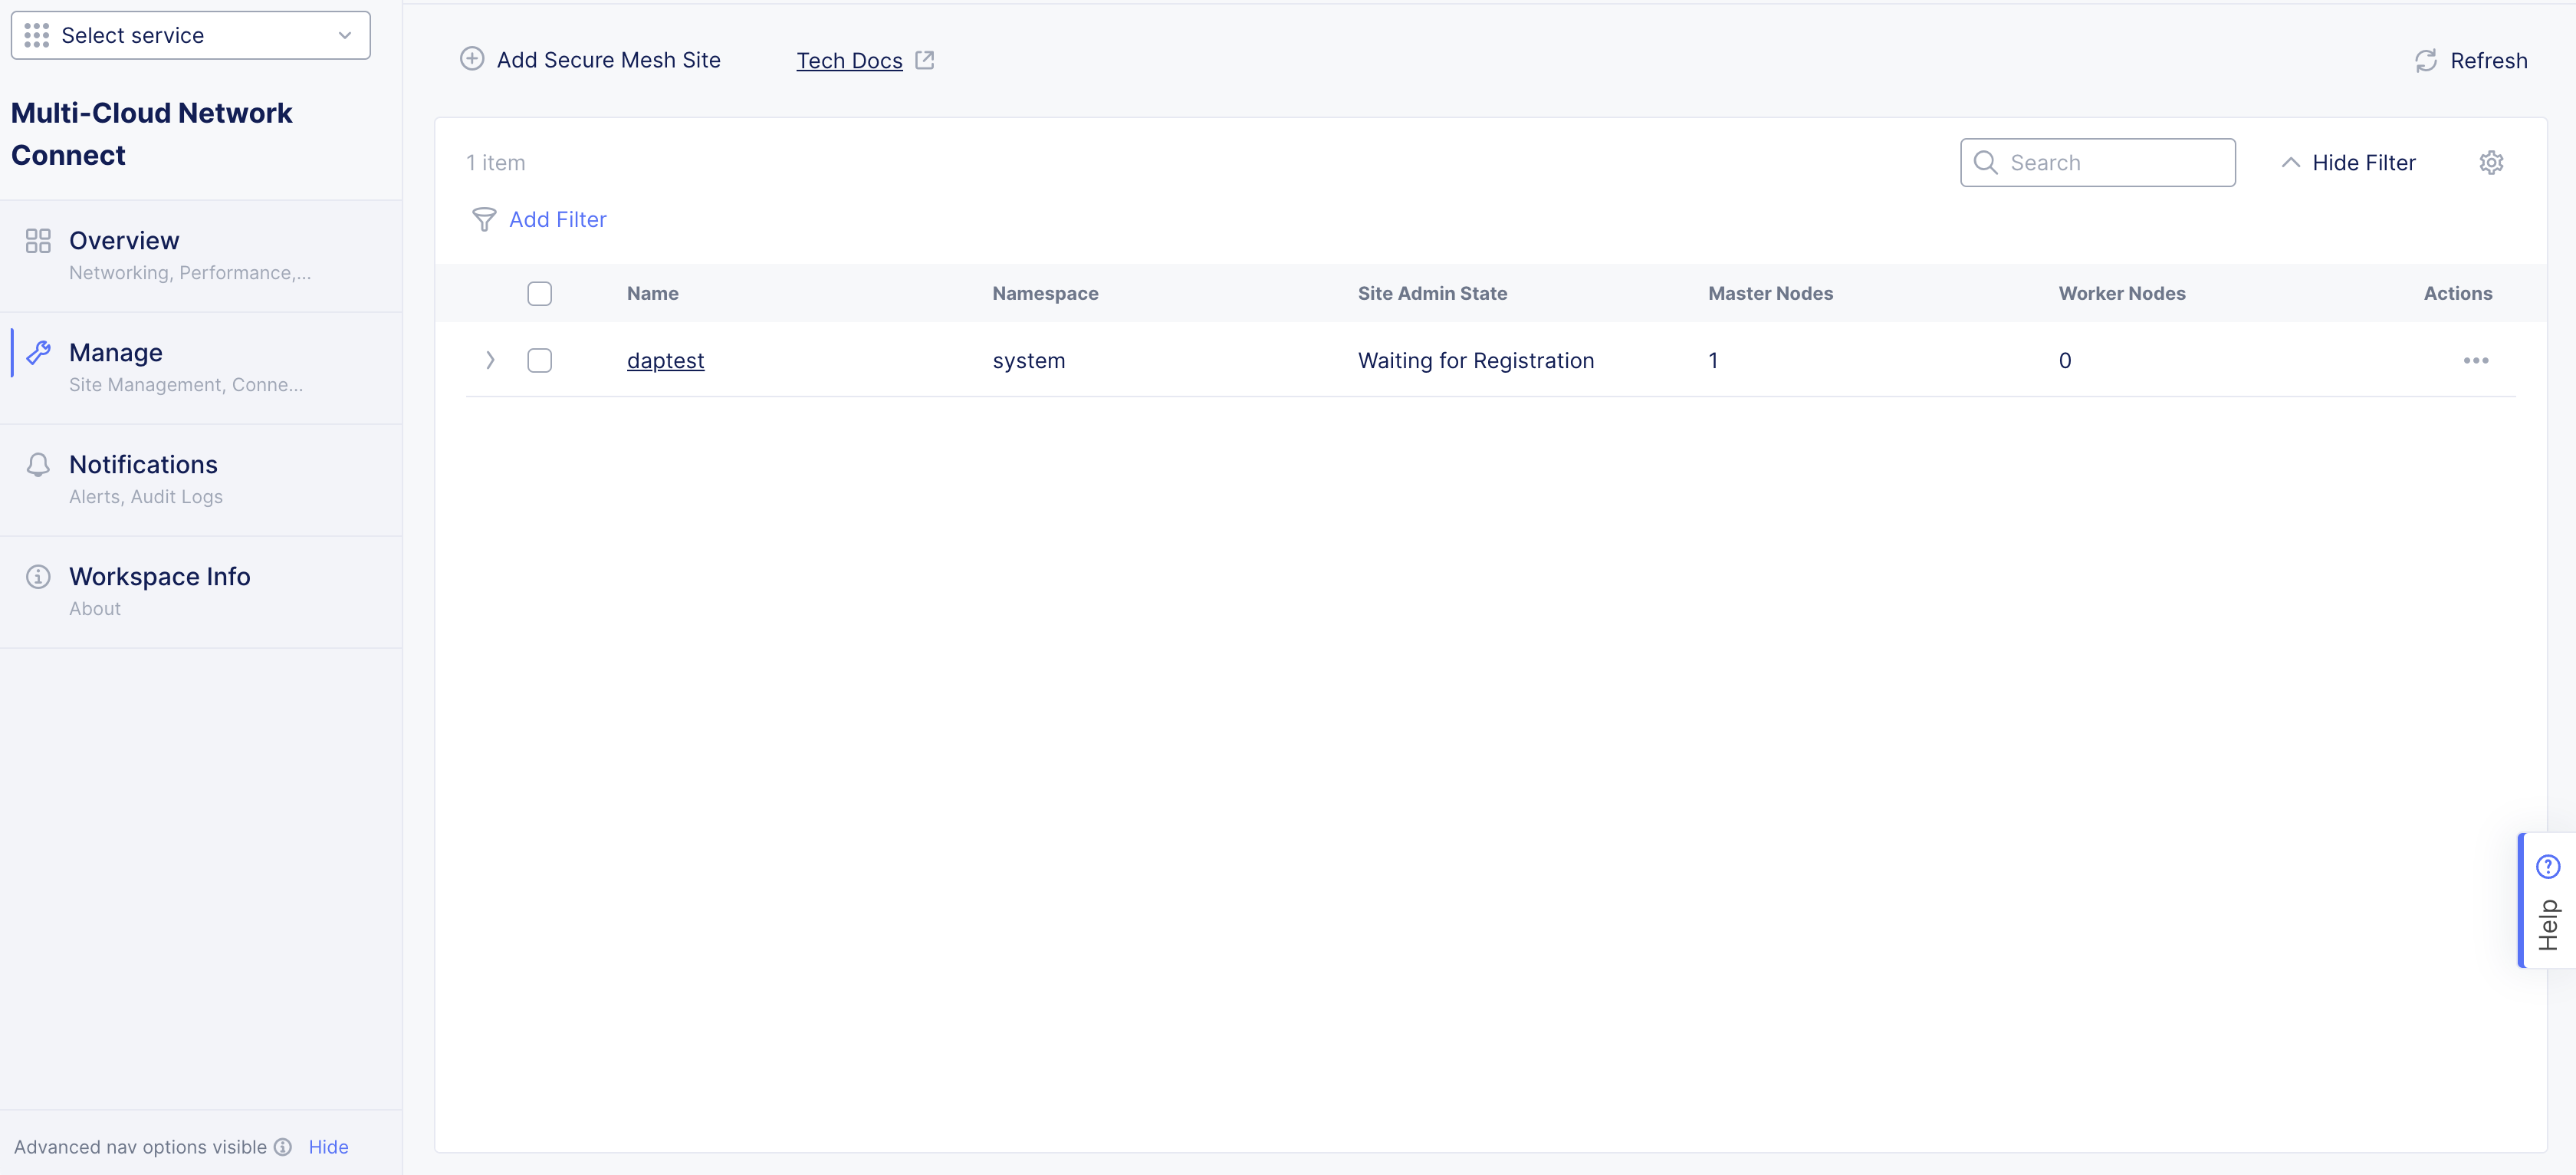
Figure: Site admin state
Node provisioning user input (cloud-init or VM scripts)
During provisioning of the node, and depending on the providers like all cloud and certain non-cloud providers, it is required that you pass site node parameters (like cloud-init or scripts). If there are errors associated with the format or any incorrect information, like token, SLO, DNS, or custom proxy information, it can hinder VPM’s ability to reach this critical information needed to bootstrap the node.
Symptoms
VPM logs indicating failure of cloud-init bootstrap information. In this case, the /etc/vpm/user_data file wasn't created or has incorrect semantics.
Aug 13 06:40:30 node-0 vpm[2443]: register.go:299: Failed registration: Failed config validation: Token is missing, waiting for Token to be provided via REST API url:65001/ves.io.vpm/introspect/write/ves.io.vpm.config/updateAug 21 11:02:11 node-1 vpm[5725]: Error: cannot read file for rSeries, token: , err: cannot unmarshal /etc/vpm/user_data, err: yaml: line 2: mapping values are not allowed in this contextAug 21 11:02:11 node-1 vpm[5725]: Vpmd command error: cannot read file for rSeries, token: , err: cannot unmarshal /etc/vpm/user_data, err: yaml: line 2: mapping values are not allowed in this contextAug 21 11:02:11 node-1 vpm[5725]: Usage:Aug 21 11:02:11 node-1 vpm[5725]: vpmd [flags]Aug 21 11:02:11 node-1 vpm[5725]: vpmd [command]Aug 21 11:02:11 node-1 vpm[5725]: Available Commands:Aug 21 11:02:11 node-1 vpm[5725]: completion Generate the autocompletion script for the specified shellAug 21 11:02:11 node-1 vpm[5725]: defaults Prints default daemon configurationAug 21 11:02:11 node-1 vpm[5725]: help Help about any commandAug 21 11:02:11 node-1 vpm[5725]: unit Prints systemd unit fileAug 21 11:02:11 node-1 vpm[5725]: version Display versionAug 21 11:02:11 node-1 vpm[5725]: Flags:Aug 21 11:02:11 node-1 vpm[5725]: --config string configuration file (default "/etc/vpm/config.yaml")Aug 21 11:02:11 node-1 vpm[5725]: -h, --help help for vpmdAug 21 11:02:11 node-1 vpm[5725]: --initial-backup Create initial backup before daemon starts (default true)Aug 21 11:02:11 node-1 vpm[5725]: --test-start Test daemon by starting and terminating immediatelyAug 21 11:02:11 node-1 vpm[5725]: Use "vpmd [command] --help" for more information about a command.Aug 21 11:02:11 node-1 systemd[1]: vpm.service: Main process exited, code=exited, status=1/FAILUREAug 21 11:02:11 node-1 systemd[1]: vpm.service: Failed with result 'exit-code'.Resolution
Make sure cloud-init format and semantics are correct as shown in the provider-specific deployment guides.
Invalid token presented by node during authentication and registration
Symptoms
To register a CE Site, you must download an authenticated and encoded token from the Distributed Cloud Console. The token is valid for seven days. Incorrect or expired tokens can result in the following errors in VPM logs.
execcli journalctl -fu vpm[...]Aug 09 09:14:57 node-4a5a0 vpm[2442]: client.go:181: Sending registration request to https://register.staging.volterra.us/registerBootstrapAug 09 09:14:57 node-4a5a0 vpm[2442]: client.go:153: Client is using proxy &InternetProxy{HttpProxy:http://159.60.140.193:443,HttpsProxy:http://159.60.140.193:443,NoProxy:10.0.0.0/8,172.16.0.0/12,192.168.0.0/16,100.127.0.0/18,100.127.192.0/18,169.254.0.0/16,int.ves.io,int.volterra.us,ProxyCacertUrl:,}Aug 09 09:14:57 node-4a5a0 vpm[2442]: register.go:767: Registration failed: Registration request: Request Register failed: Response with non-OK status code: 500, content: Unknown token: Token doesn't exist,, retry in 1m5.524906138sAug 09 09:14:57 node-4a5a0 vpm[2442]: checker.go:213: Starting check for new workload version, with timeout 40m0sAug 09 09:14:57 node-4a5a0 vpm[2442]: checker.go:112: running all cron tasks in another routineVerify the validity of the token (JWT) being used by inputting token into any JWT online decoder tool, such as jwt.io, by inputting the token into the Encoded area and hovering your mouse over the exp field in the payload area. Additional information about the site name, tenant name, and HTTP endpoints are very helpful to ensure validity and that the public endpoints are accurate for your site.
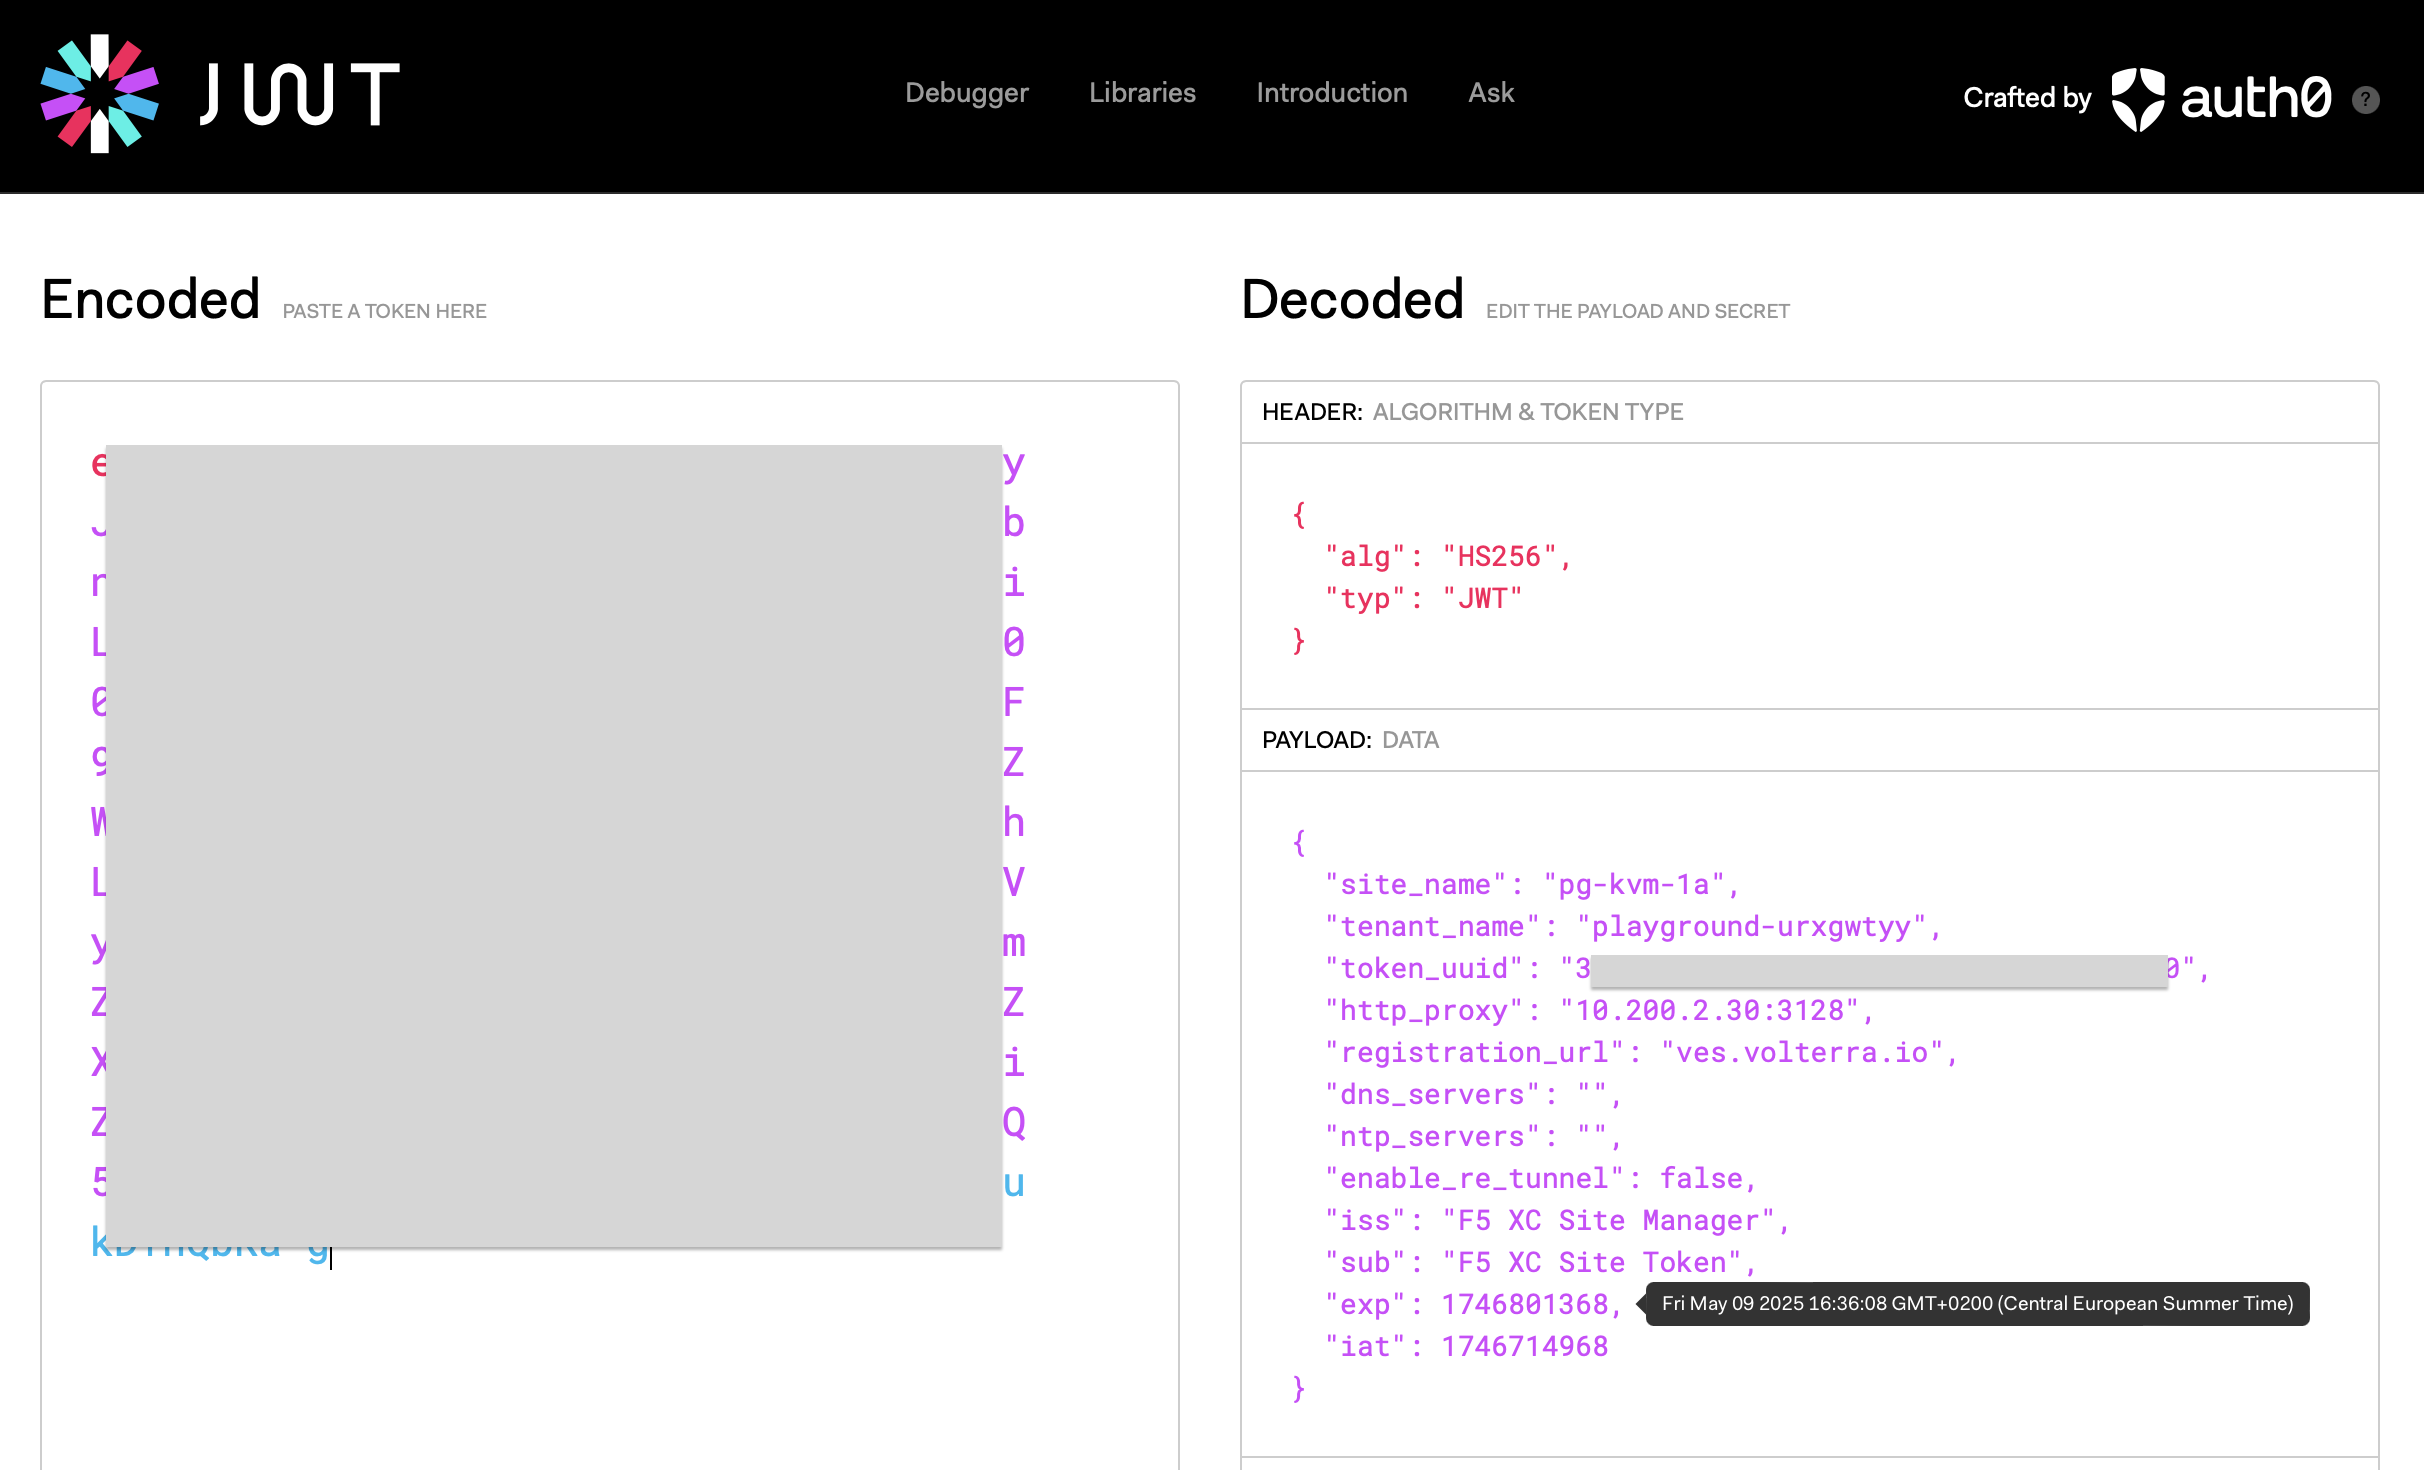
Figure: JWT payload
Resolution
If the token validity has passed, use it for node creation.
If there is a logical issue, ensure you generate a new token if validation of the token is not passed. For example, this may include an expired token, wrong site name, proxy configuration, and more.
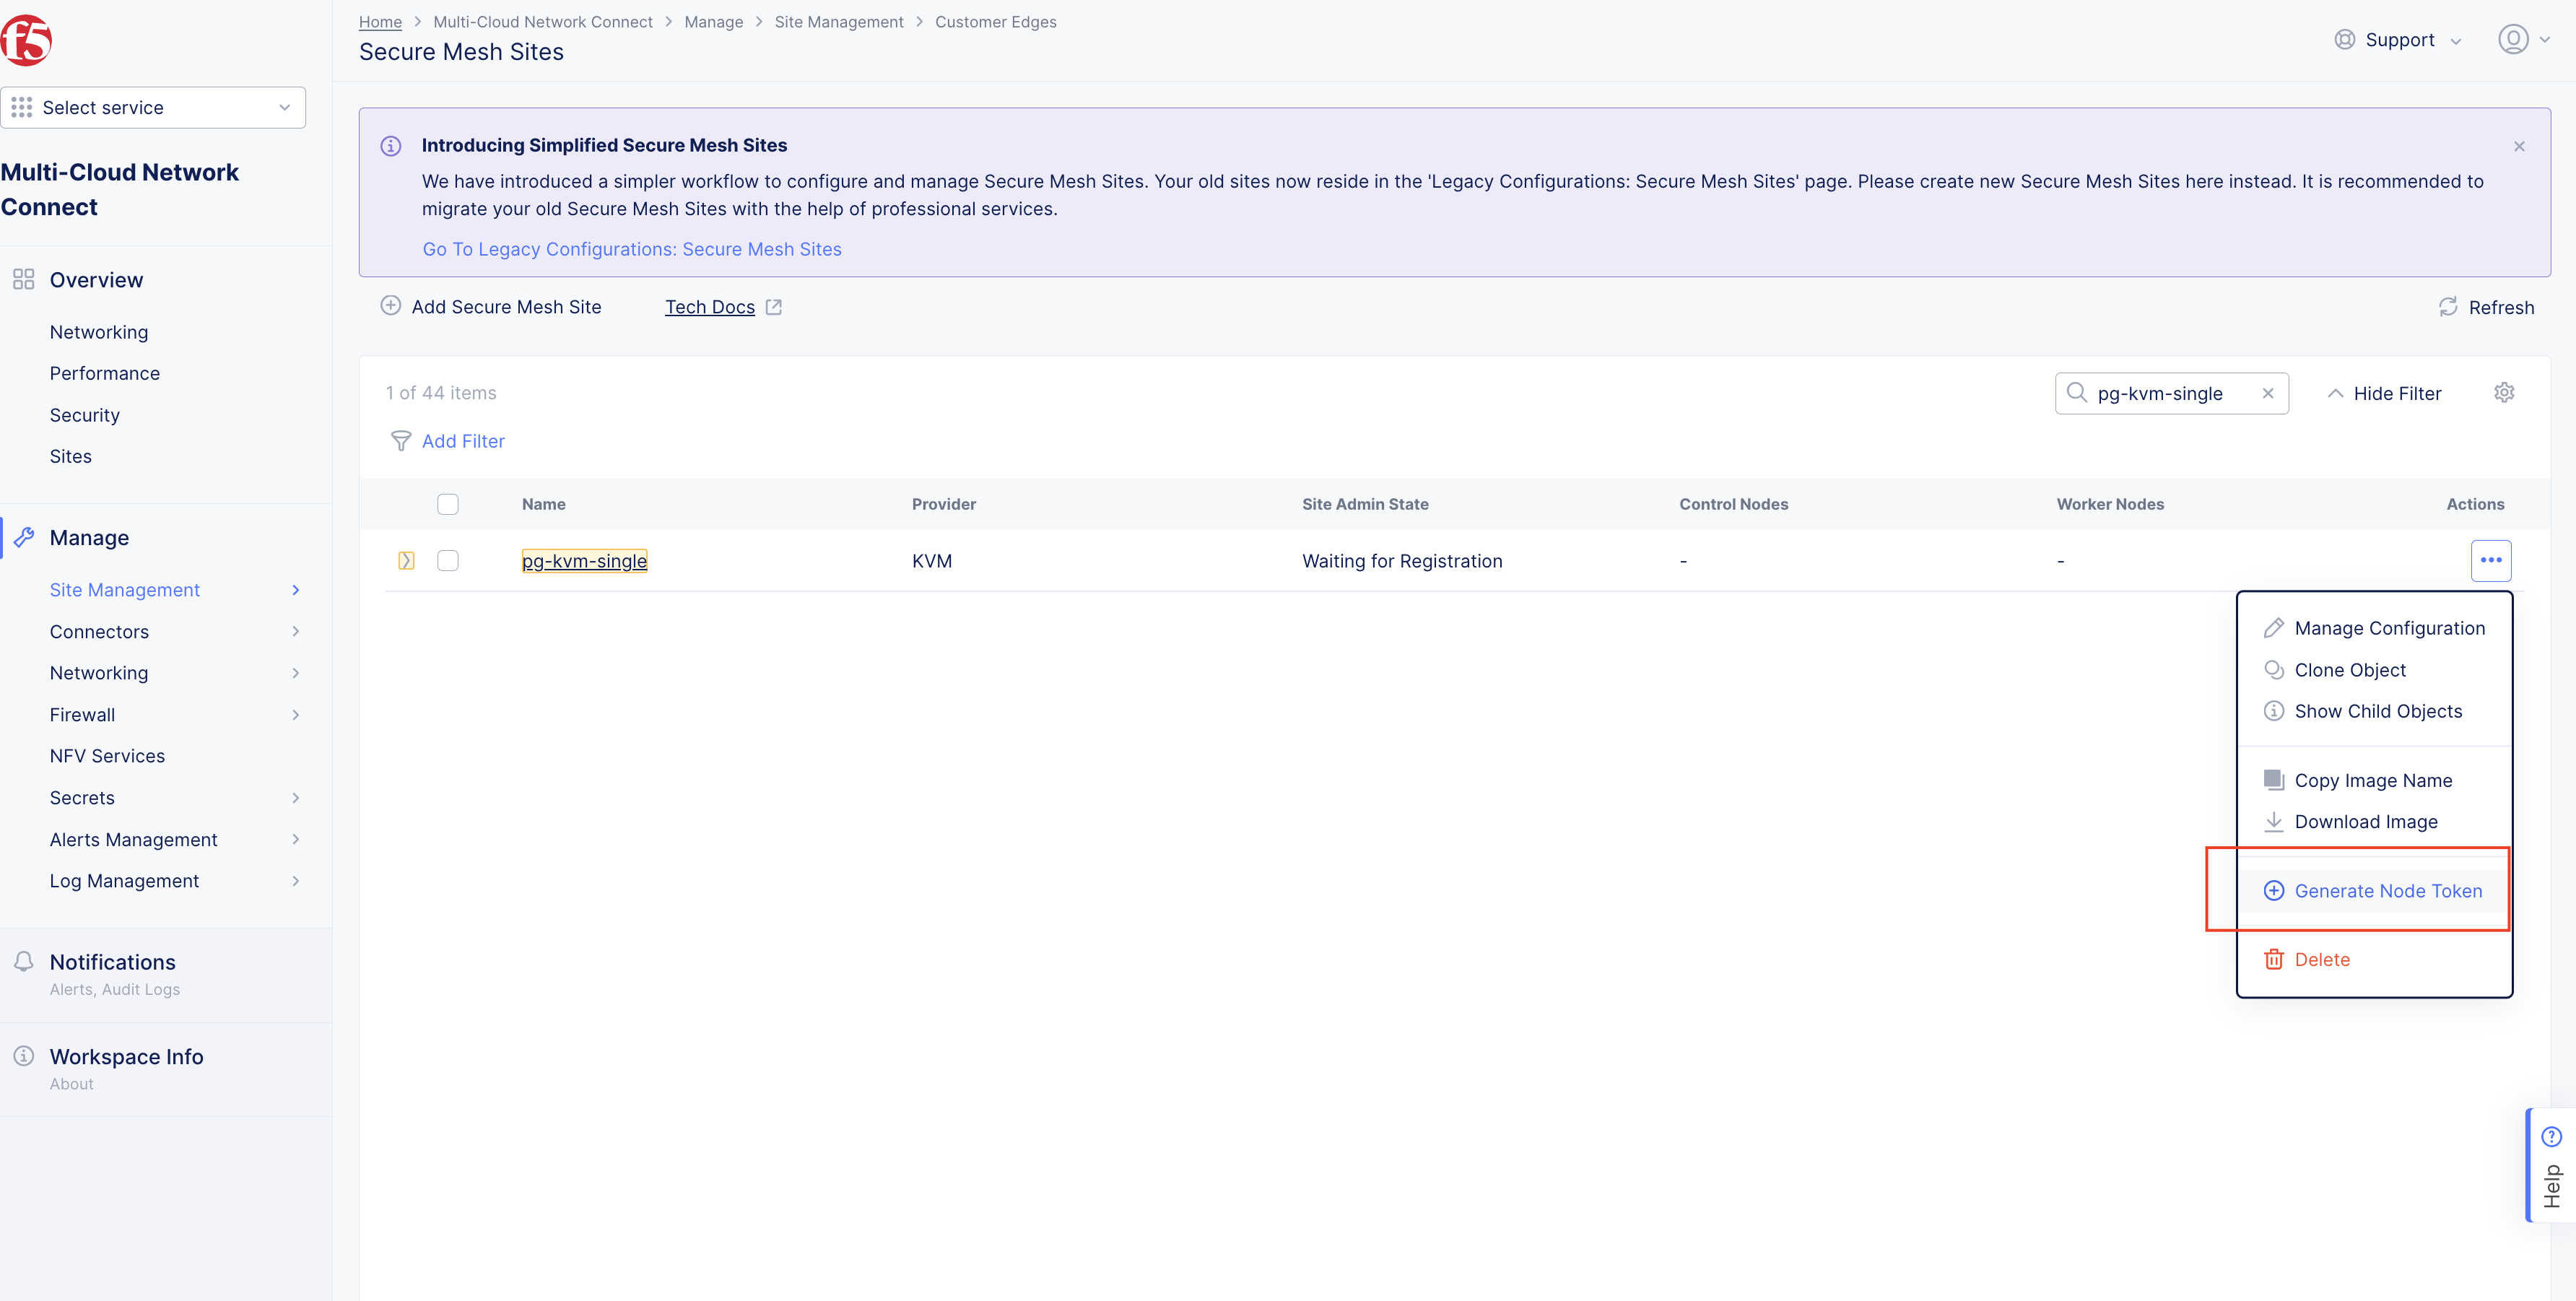
Figure: Node token
Node network connectivity issues
Symptoms
If the site is in Waiting for Registration state for a prolonged period (greater than 30 minutes), the issue could be with network connectivity: wrong SLO IP, GW, or DNS. To verify connectivity, log in to the node's Site CLI terminal and run the following commands:
$$$$$$\ $$\ $$\ $$$$$$\ $$\ $$$$$$\$$ __$$\ \__| $$ | $$ __$$\ $$ | \_$$ _|$$ / \__|$$\ $$$$$$\ $$$$$$\ $$ / \__|$$ | $$ |\$$$$$$\ $$ |\_$$ _| $$ __$$\ $$ | $$ | $$ | \____$$\ $$ | $$ | $$$$$$$$ |$$ | $$ | $$ |$$\ $$ |$$ | $$ |$$\ $$ ____|$$ | $$\ $$ | $$ |\$$$$$$ |$$ | \$$$$ |\$$$$$$$\ \$$$$$$ |$$$$$$$$\ $$$$$$\ \______/ \__| \____/ \_______| \______/ \________|\______|WELCOME IN SITE CLIThis allows to:- configure registration information- factory reset of the Node- collect debug information for supportUse TAB to select various options.>>> execcli ping 8.8.8.8cat: /etc/systemd/system/kubelet.service: No such file or directoryping: connect: Network is unreachable>>> execcli ip acat: /etc/systemd/system/kubelet.service: No such file or directory1: lo: <LOOPBACK,UP,LOWER_UP> mtu 65536 qdisc noqueue state UNKNOWN group default qlen 1000 link/loopback 00:00:00:00:00:00 brd 00:00:00:00:00:00 inet 127.0.0.1/8 scope host lo valid_lft forever preferred_lft forever2: ens3: <BROADCAST,MULTICAST,UP,LOWER_UP> mtu 1500 qdisc fq_codel state UP group default qlen 1000 link/ether 52:54:00:ca:15:68 brd ff:ff:ff:ff:ff:ff altname enp0s33: docker0: <NO-CARRIER,BROADCAST,MULTICAST,UP> mtu 1500 qdisc noqueue state DOWN group default link/ether 02:42:55:7a:c6:28 brd ff:ff:ff:ff:ff:ff inet 100.64.255.1/29 brd 100.64.255.7 scope global docker0 valid_lft forever preferred_lft foreverIf IP connectivity works, check the DNS resolution.
>>> execcli curl-host google.com<HTML><HEAD><meta http-equiv="content-type" content="text/html;charset=utf-8"><TITLE>301 Moved</TITLE></HEAD><BODY><H1>301 Moved</H1>The document has moved<A HREF="http://www.google.com/">here</A>.</BODY></HTML>Resolution
Check if the DHCP server exists in the network if DHCP is the chosen method for SLO IP address allocation, and ensure it is able to allocate an IP address for the SLO interface of the node. If you wish to adjust the DNS IP address or adjust IP address allocation method from static to DHCP or vice versa, delete the node and provision a new node with the correct DNS or IP address assignment using cloud-init, scripts, or OVA template depending on the provider.
Symptoms
If other connectivity issues occur, run the diagnosis command.
Resolution
The diagnosis command provides:
- Critical checks for deployment and work domain reachability
- Registration status
- ARP table
- Configured DNS connectivity (ping test)
- DNS resolution (done by curl and dig)
- Gateway connectivity
- Interface information (ifconfig)
- NTP sync status
- Output from /etc/resolv.conf
- Host routing table (route -n)
$$$$$$\ $$\ $$\ $$$$$$\ $$\ $$$$$$\$$ __$$\ \__| $$ | $$ __$$\ $$ | \_$$ _|$$ / \__|$$\ $$$$$$\ $$$$$$\ $$ / \__|$$ | $$ |\$$$$$$\ $$ |\_$$ _| $$ __$$\ $$ | $$ | $$ | \____$$\ $$ | $$ | $$$$$$$$ |$$ | $$ | $$ |$$\ $$ |$$ | $$ |$$\ $$ ____|$$ | $$\ $$ | $$ |\$$$$$$ |$$ | \$$$$ |\$$$$$$$\ \$$$$$$ |$$$$$$$$\ $$$$$$\ \______/ \__| \____/ \_______| \______/ \________|\______|WELCOME IN SITE CLIThis allows to:- configure registration information- factory reset of the Node- collect debug information for supportUse TAB to select various options.>>> diagnosisNode network connectivity issues toward public F5 site registration endpoint
With the new Secure Mesh Site v2, all the node communication toward F5 Distributed Cloud for the purposes of registration are provisioning is directed toward a global highly available public proxy hosted by F5 Distributed Cloud to simplify node registration and provisioning process. The proxy IP address is an anycast address that is available globally throughout F5 PoPs. Policies or firewall rules may block the communication between the CE to the proxy IP address.
Symptoms
Check proxy connectivity reachability by finding the HTTP proxy information by decoding the token used for provisioning at jwt.io. On the node's Site CLI shell, run a quick ping test toward the HTTP proxy IP address and any other public endpoints to verify DNS and proxy reachability. Also observe the VPM logs.
The IP address used is for demonstration purposes. The actual IP address for the proxy is derived from the site token.
$$$$$$\  $$\   $$\                $$$$$$\  $$\       $$$$$$\$$  __$$\ \__|  $$ |              $$  __$$\ $$ |      \_$$  _|$$ /  \__|$$\ $$$$$$\    $$$$$$\  $$ /  \__|$$ |        $$ |\$$$$$$\  $$ |\_$$  _|  $$  __$$\ $$ |      $$ |        $$ | \____$$\ $$ |  $$ |    $$$$$$$$ |$$ |      $$ |        $$ |$$\   $$ |$$ |  $$ |$$\ $$   ____|$$ |  $$\ $$ |        $$ |\$$$$$$  |$$ |  \$$$$  |\$$$$$$$\ \$$$$$$  |$$$$$$$$\ $$$$$$\ \______/ \__|   \____/  \_______| \______/ \________|\______|WELCOME IN SITE CLIThis allows to:- configure registration information- factory reset of the Node- collect debug information for supportUse TAB to select various options.>>> >>> execcli curl-host http://159.60.140.193:443

curl: (28) Failed to connect to 159.60.140.193 port 443: Connection timed out

>>> ping 8.8.8.8
--- 8.8.8.8 ping statistics ---5 packets transmitted, 5 packets received, 0% packet lossround-trip min/avg/max/stddev = 9.51202ms/9.559214ms/9.682389ms/62.34µs
Observe VPM logs with the following log signatures:
execcli journalctl -fu vpm[...]Aug 12 12:02:14 node-e6f4d vpm[2433]: client.go:181: Sending registration request to https://register.staging.volterra.us/registerBootstrapAug 12 12:02:14 node-e6f4d vpm[2433]: client.go:153: Client is using proxy &InternetProxy{HttpProxy:http://159.60.140.193:443,HttpsProxy:http://159.60.140.193:443,NoProxy:10.0.0.0/8,172.16.0.0/12,192.168.0.0/16,100.127.0.0/18,100.127.192.0/18,169.254.0.0/16,int.ves.io,int.volterra.us,ProxyCacertUrl:,}Aug 12 12:02:44 node-e6f4d vpm[2433]: client.go:188: Unable to parse registration error: unexpected end of JSON inputAug 12 12:02:44 node-e6f4d vpm[2433]: register.go:767: Registration failed: Registration request: Request Register failed: Request error: Post "https://register.staging.volterra.us/registerBootstrap": proxyconnect tcp: dial tcp 159.60.140.193:443: i/o timeout, retry in 1m3.934307169sResolution
Check your network firewall to ensure communication to the F5 HTTP Proxy endpoint is allowed on port 443. After adjusting your network and security settings for this connectivity to work, you can trigger a registration with a reboot of the node.
Not enough CPU or memory resources allocated to node
Symptoms
Check for node VPM logs to spot not enough memory or CPU log messages.
execcli journalctl -fu vpm[...]Aug 08 11:14:16 node-a4124 vpm[2962]: register.go:763: Registration failed: Registration request: Request Register failed: Response with non-OK status code: 500, content: {"code":13,"details":[],"message":"fail to auto approve site 9c439aaa-dc68-4491-8630-a19ee846efd4, err: rpc error: code = FailedPrecondition desc = Registration validation failed: Minimum Memory requirement 14000 is not met, registration has 13000"}, retry in 1m5.203464305sexeccli journalctl -fu vpm[...]Aug 07 14:19:07 node-469c2 vpm[2870]: register.go:763: Registration failed: Registration request: Request Register failed: Response with non-OK status code: 500, content: {"code":13,"details":[],"message":"fail to auto approve site 0ada3d48-bb50-45e3-a768-6cb41a4da931, err: rpc error: code = FailedPrecondition desc = Registration validation failed: Minimum CPU requirement 4 is not met, registration has 2"}, retry in 1m5.419818009sResolution
Re-provision the node with the minimum requirements, as indicated in the Customer Edge Site Sizing Reference guide: 16 GB RAM or 4 CPU cores.
Connectivity to public image repositories (gcr.io) for node provisioning
Symptom
Check the VPM logs to observe signatures indicating the node has challenges downloading images from public Docker repositories due to security requirements that mandate a proxy in your environment.
execcli journalctl -fu vpm[...]Aug 09 13:19:53 node-75cc1 systemd[1]: Started VP Manager service.Aug 09 13:19:53 node-75cc1 vpm[2753]: Unable to find image 'gcr.io/volterraio/vpm@sha256:71f9c31923967be28556d34e8abe6acb8b1d5e4e0600f3b6d2c87421f7bdcded' locallyAug 09 13:19:53 node-75cc1 vpm[2753]: docker: Error response from daemon: Get "https://gcr.io/v2/": Forbidden.Aug 09 13:19:53 node-75cc1 vpm[2753]: See 'docker run --help'.Aug 09 13:19:53 node-75cc1 systemd[1]: vpm.service: Main process exited, code=exited, status=125/n/aAug 09 13:19:53 node-75cc1 systemd[1]: vpm.service: Failed with result 'exit-code'.Resolution (Local Proxy)
Check your local network environment where the node is provisioned to see if a proxy is needed to connect to public endpoints. Re-provision the node if your local environment mandates a proxy for adjusting the scripts to indicate the proxy IP address.
- In Distributed Cloud Console, navigate to your site and edit the configuration.
- Select the Site Management link from the left menu.
- From the Enterprise Proxy list, select Custom Enterprise Proxy.
- Enter your proxy server IP address and port.
- Optionally, configure a username and password.
- Optionally, choose to have your internal proxy server use F5 RE tunnels by choosing Enable from the Use for RE Tunnels list.
Important: When Use for RE Tunnels is on, the CE site always establishes an SSL tunnel connection to the REs, even when the Regional Edge tunnel type is set to IPSec and SSL. After the site comes online, the system automatically changes the RE tunnel type to SSL. If RE tunnels use a custom proxy, IPsec isn't supported because Internet Key Exchange (IKE) uses UDP and can't be routed through a custom proxy. As a result, the system turns off IPsec and only uses SSL.
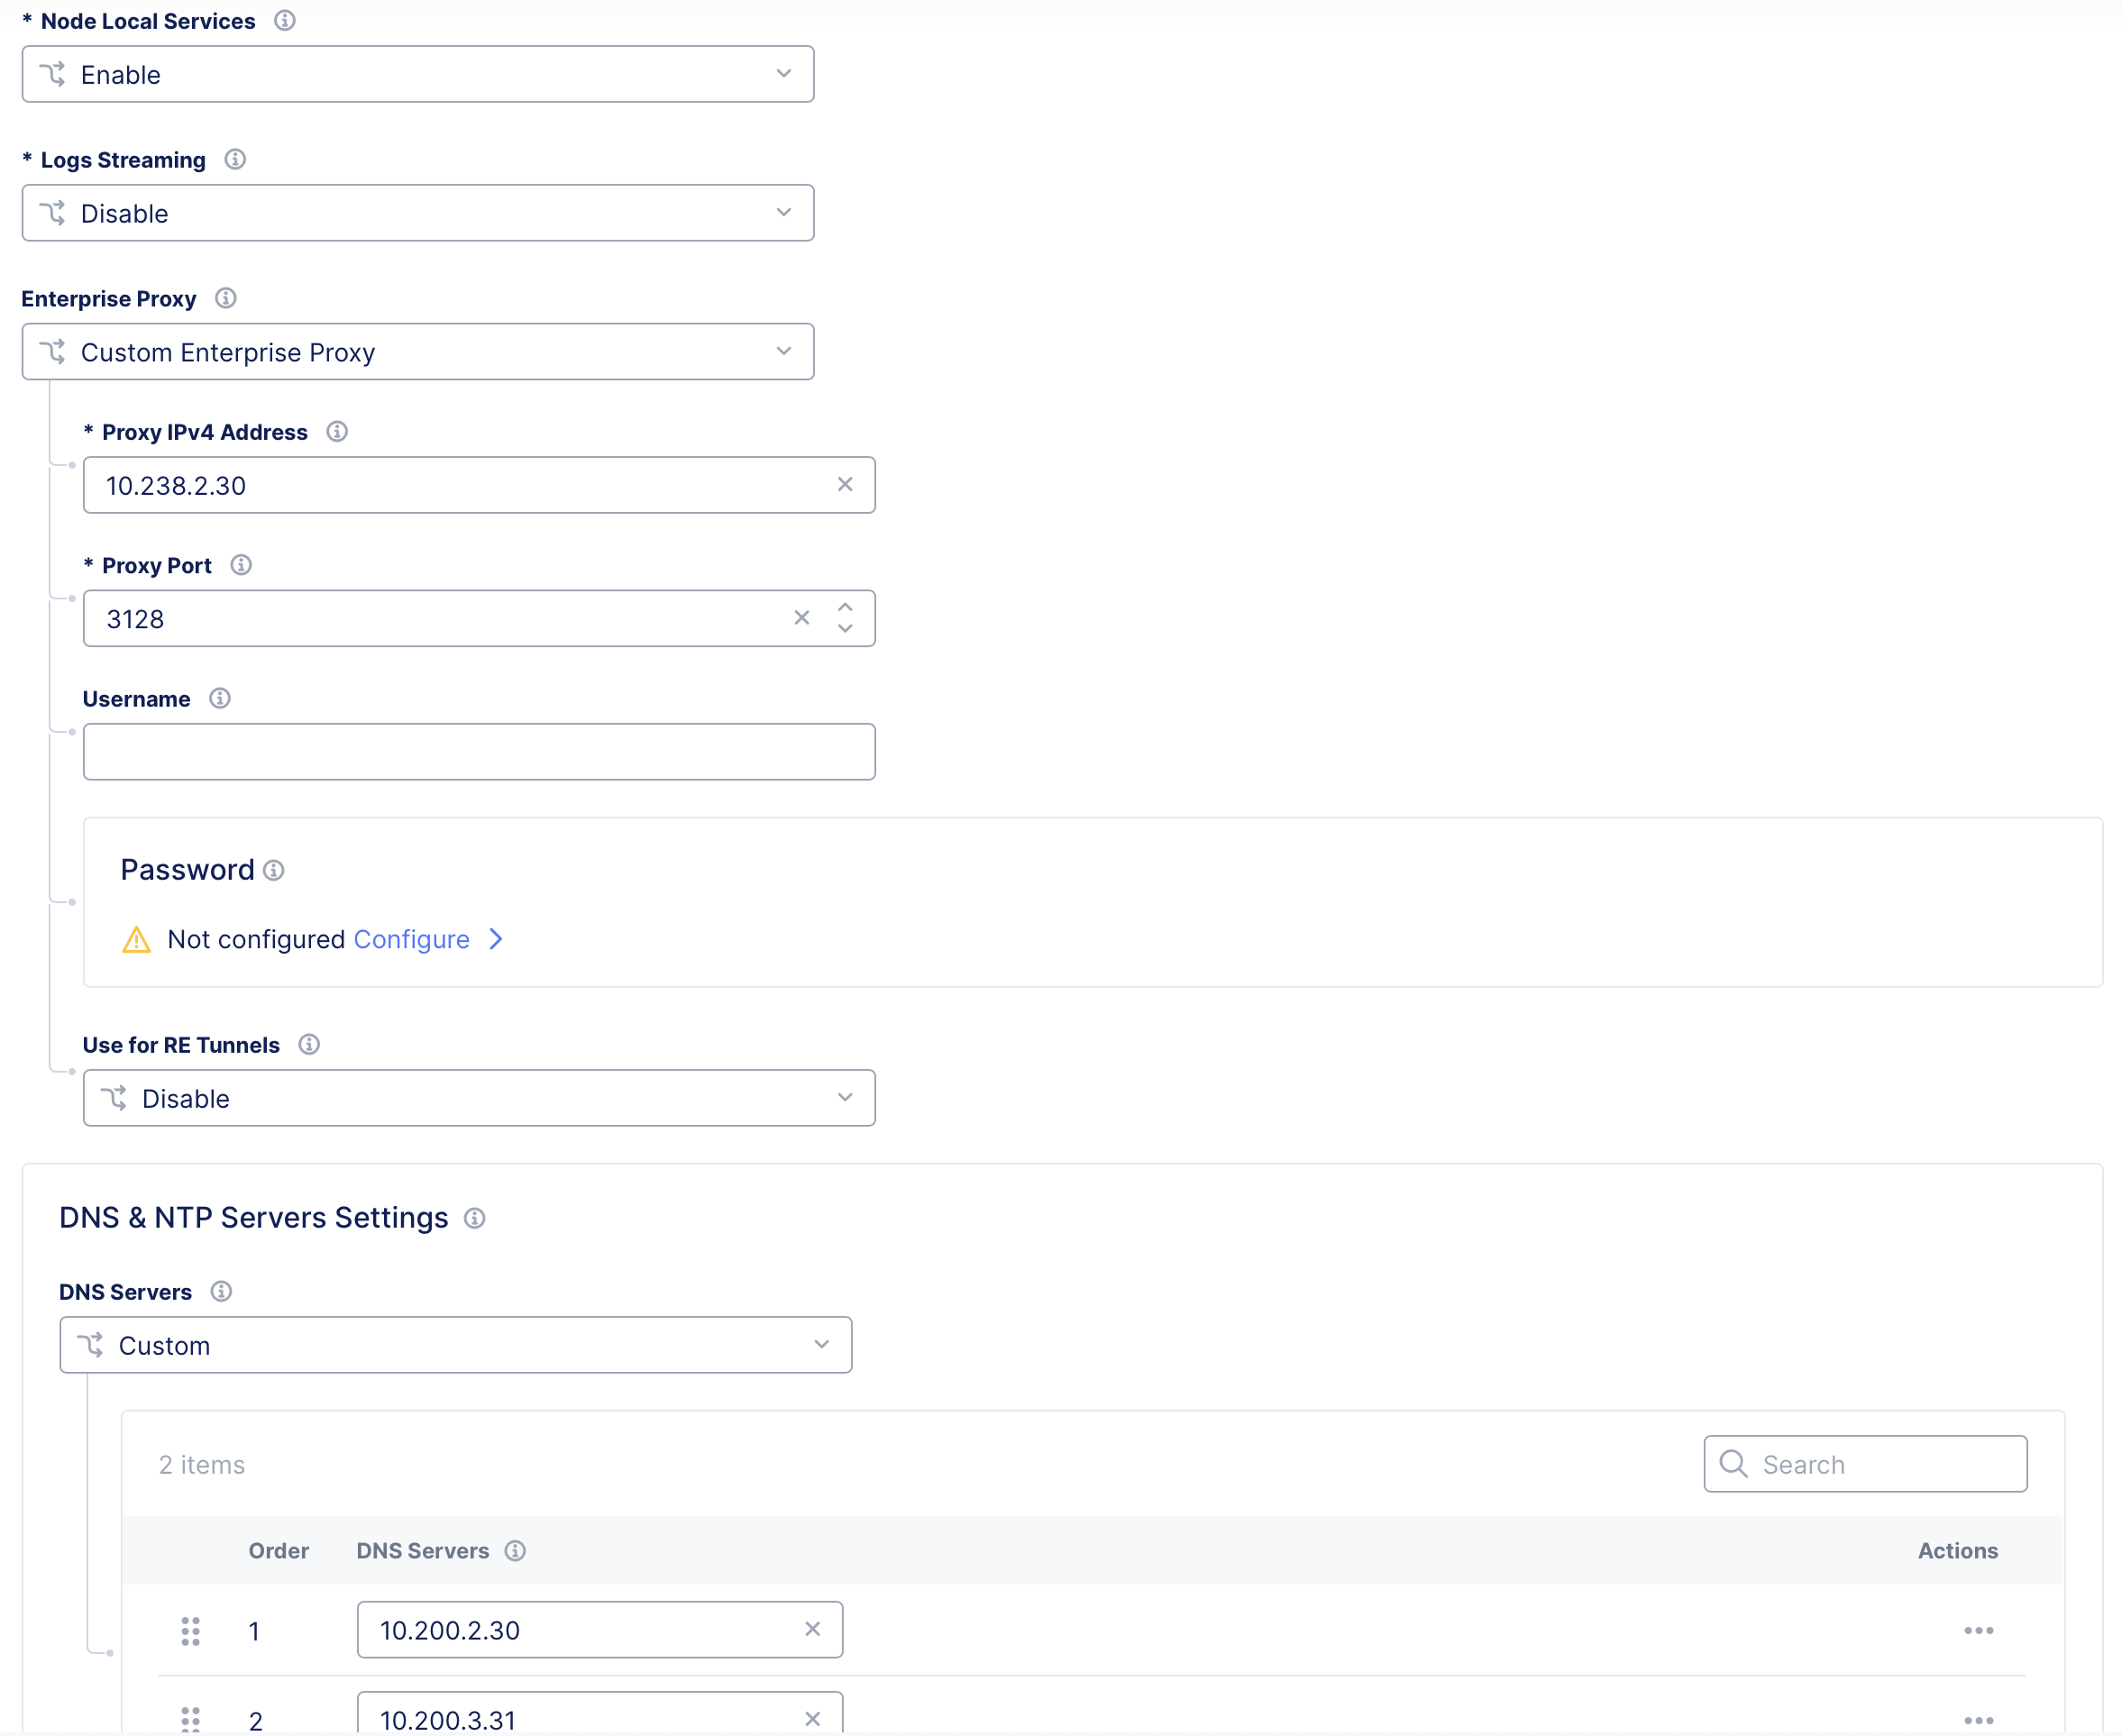
Figure: Use for RE tunnels
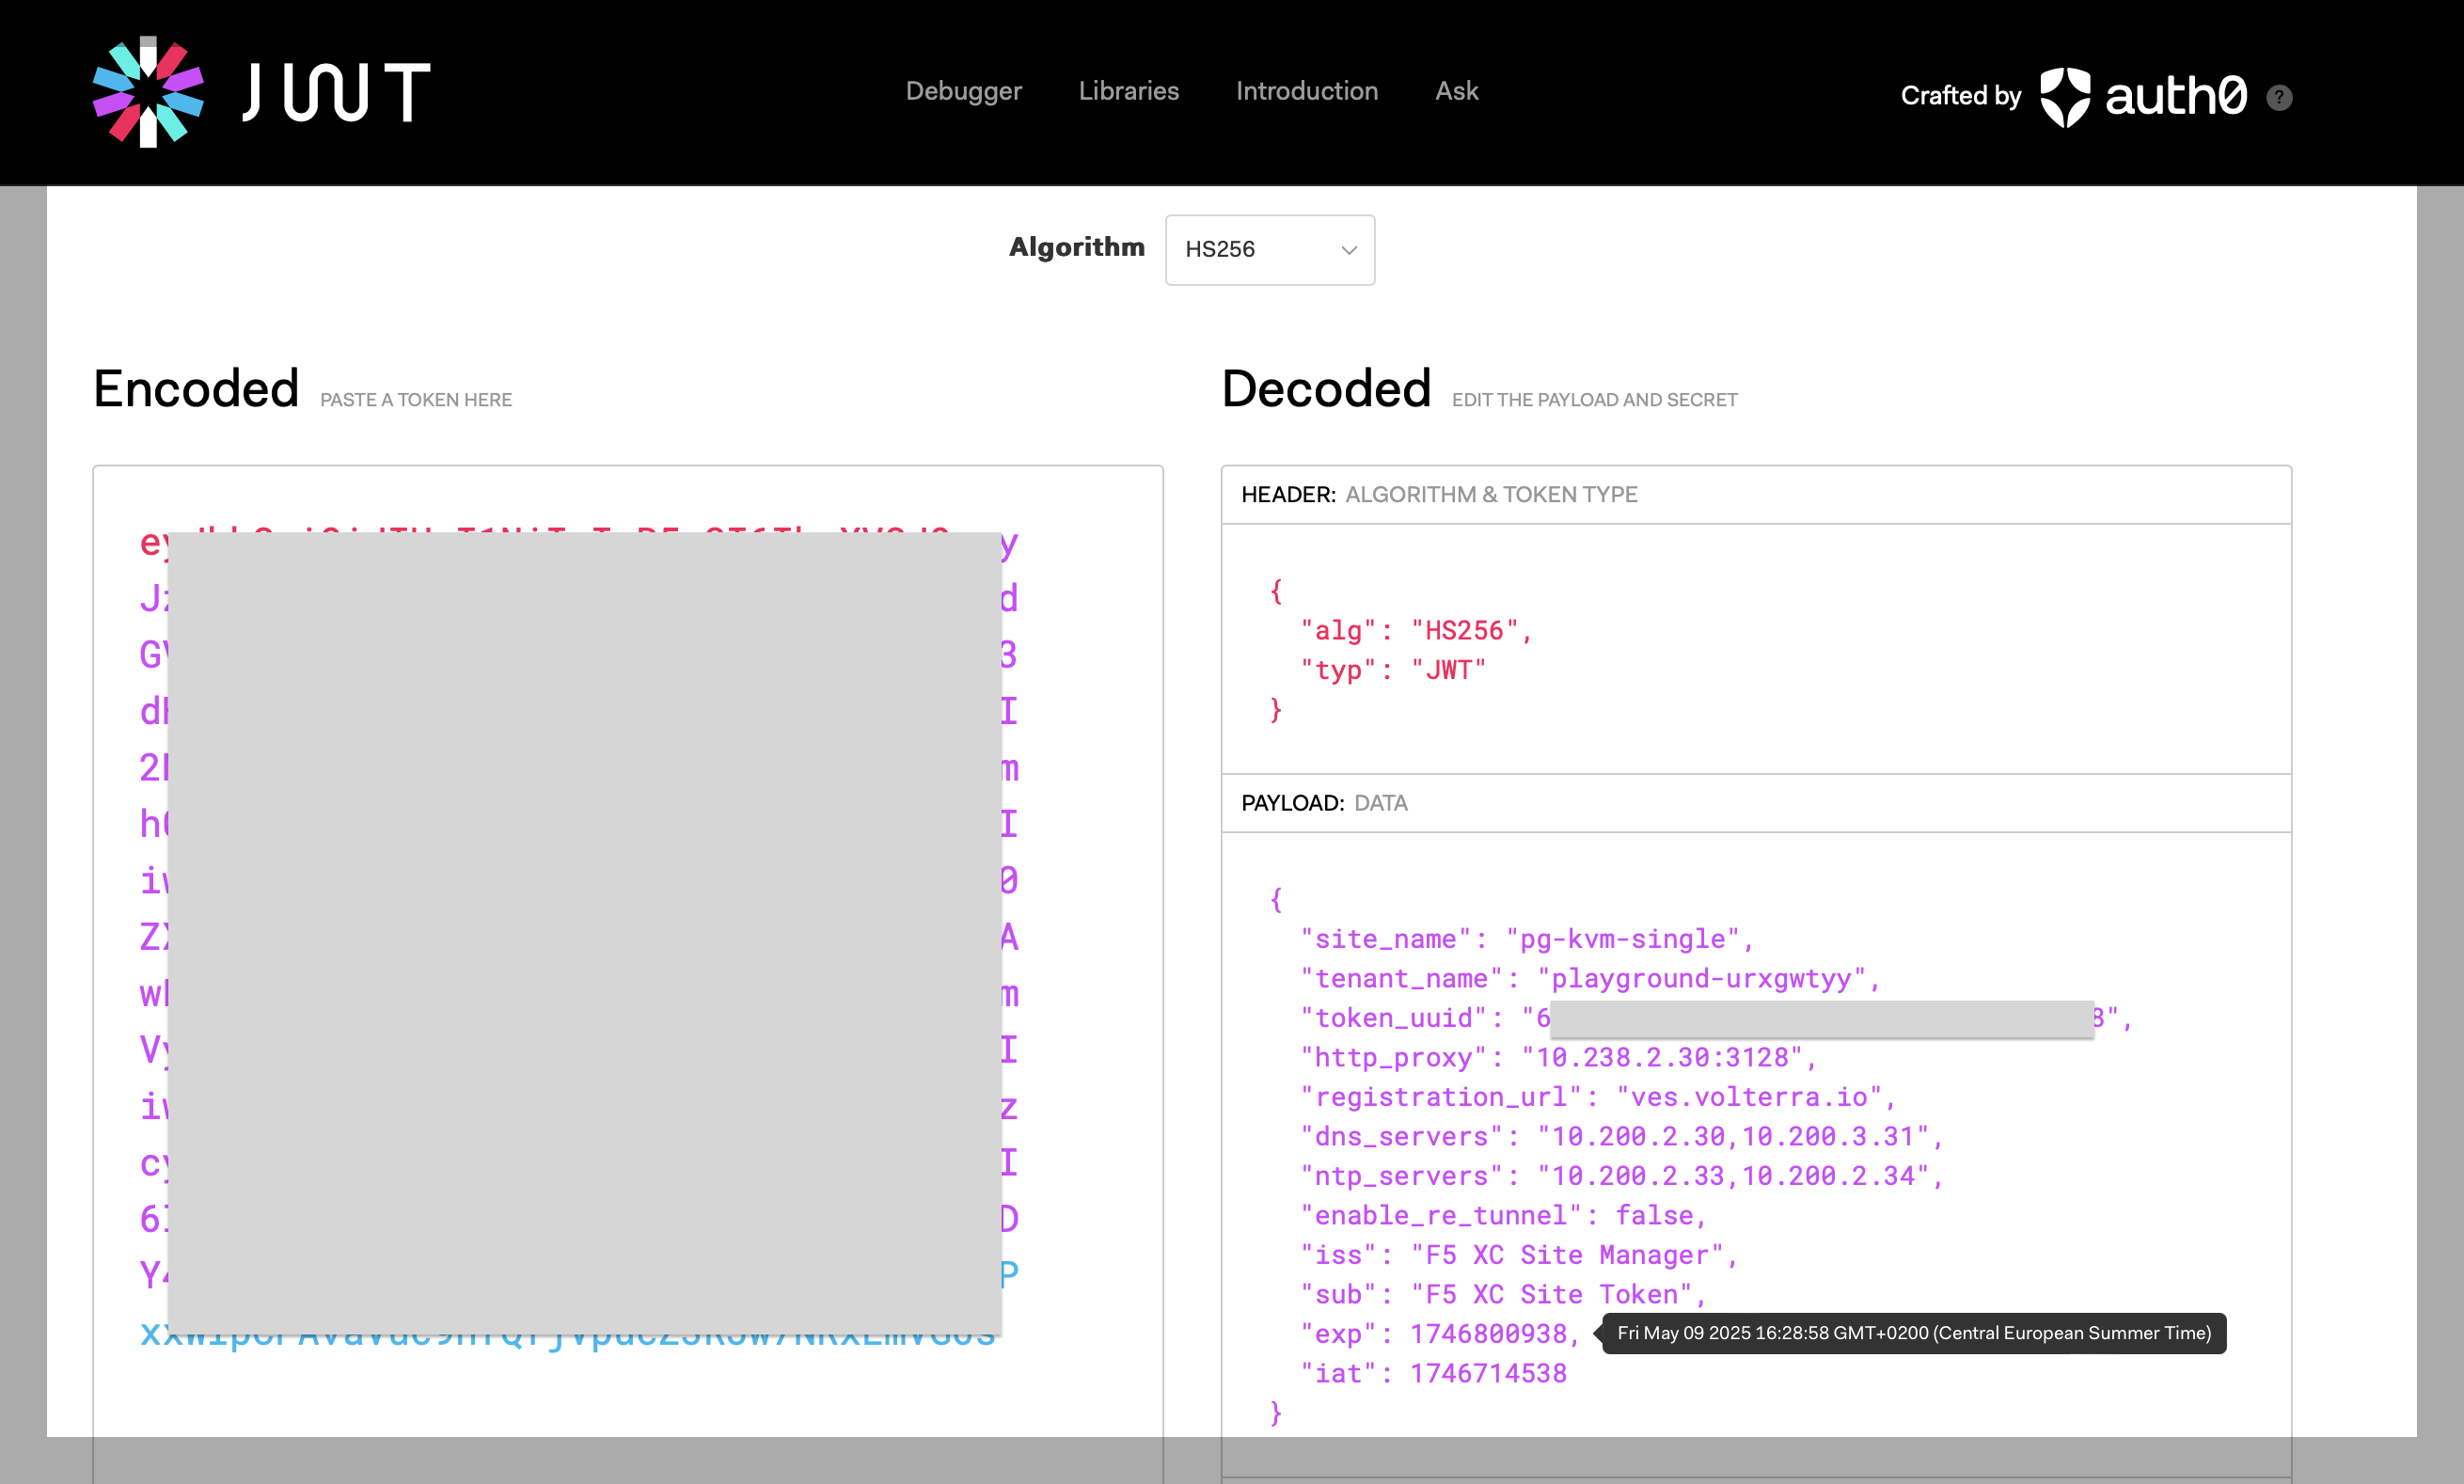
Figure: JWT output example
Resolution (L3 or L7 Firewall)
Configure your L3 or L7 firewall to allow domains needed for registration and provisioning. You can find the IP addresses and domains at Firewall and Proxy Server Allowlist Reference.
Common site provision failure scenarios during deployment
There are situations where the site progresses past registration but gets stuck in Provisioning state for a long time (multiple hours). In this case, it could be that the node was created and properly registered, but deployment of the node didn't complete successfully.

Figure: Site status provisioning
This is a list of potential scenarios that could result in a site stuck in the Provisioning state:
- Site nodes with hostname duplication issues
- Site nodes with duplicate IP addresses
- Site node tunnels to RE are unhealthy
Node hostname duplication issue
All nodes in a CE site must have unique hostnames. If you don't provide a hostname during node provisioning, the system automatically generates one. This typically occurs when the same hostname is used multiple times in a cluster.
Symptom
Console prompt shows the same node hostname (for example, node-0) for two or more nodes.
Red Hat Enterprise Linux 9.2024.22.4 (Plow)Kernel 5.14.0-427.22.1.el9_4.x86_64 on an x86_64
node-0 login:
Upon examining the VPM logs, the error Duplicate Keys for the same node message can be observed. The log example shows that for node-0 multiple keys were found. This indicates that there are multiple node-0 nodes.
execcli journalctl -fu vpm[...]Aug 13 06:09:42 node-0 vpm[2873]: register.go:763: Registration failed: Registration request: Request Register failed: Response with non-OK status code: 409, content: Create: Adding with usage transaction: STM Error: Applying transaction function: txn.AddEntry: AddEntry(ves.io.schema.registration.Object.default)[…] UniqueSecondaryIndexViolationError(Etcd:/maurice/db/ves.io.schema.registration.Object.default) IndexName: TenantClusterNameHostnameIndex, Value playground-wtppvaog/pg-kvm-cluster-8/node-0, Key: 9d7d2ef1-978f-4030-a766-d9e4c80d0a89, Duplicate Keys: fe7d2bda-3e41-4ef6-a564-32fa2b927bb6,, retry in 1m4.781248518sResolution
Re-deploy the cluster with unique nodes names, or do not pass on node name info in cloud-init, scripts, or OVA template. Let the system allocate a unique name for each node.
Nodes with duplicate IP addresses
Symptom
For nodes that aren't able to finish provisioning or SSH login to them is unpredictable, it's highly likely that there is an IP address duplication issue among site nodes on the SLO network. In the VPM logs, various errors indicate potential duplicate IP address issues. For example, a node timeout connects to a proxy as multiple nodes connect using the same node IP address toward the registration/provisioning endpoint. You can confirm this symptom by looking at the VPM logs or by logging into the node to cross-check the node's IP address using Site CLI shell commands.
Aug 13 11:18:17 node-0 vpm[4916]: retry.go:188: Function failed. 50 retries left, err: Request ReportOperatingSystemStatus failed: Request error: Post "https://register-tls.staging.volterra.us/ves.io.maurice.site/reportosstatus": proxyconnect tcp: dial tcp 159.60.140.193:443: i/o timeout $$$$$$\ $$\ $$\ $$$$$$\ $$\ $$$$$$\$$ __$$\ \__| $$ | $$ __$$\ $$ | \_$$ _|$$ / \__|$$\ $$$$$$\ $$$$$$\ $$ / \__|$$ | $$ |\$$$$$$\ $$ |\_$$ _| $$ __$$\ $$ | $$ | $$ | \____$$\ $$ | $$ | $$$$$$$$ |$$ | $$ | $$ |$$\ $$ |$$ | $$ |$$\ $$ ____|$$ | $$\ $$ | $$ |\$$$$$$ |$$ | \$$$$ |\$$$$$$$\ \$$$$$$ |$$$$$$$$\ $$$$$$\ \______/ \__| \____/ \_______| \______/ \________|\______|WELCOME IN SITE CLIThis allows to:- configure registration information- factory reset of the Node- collect debug information for supportUse TAB to select various options.>>> execcli ip a1: lo: <LOOPBACK,UP,LOWER_UP> mtu 65536 qdisc noqueue state UNKNOWN group default qlen 1000 link/loopback 00:00:00:00:00:00 brd 00:00:00:00:00:00 inet 127.0.0.1/8 scope host lo valid_lft forever preferred_lft forever2: ens3: <BROADCAST,MULTICAST,UP,LOWER_UP> mtu 1500 qdisc fq_codel state UP group default qlen 1000 link/ether 52:54:00:dd:2d:64 brd ff:ff:ff:ff:ff:ff altname enp0s3 inet 192.168.122.219/24 brd 192.168.122.255 scope global dynamic noprefixroute ens3 valid_lft 3552sec preferred_lft 3552sec inet6 fe80::5054:ff:fedd:2d64/64 scope link noprefixroute valid_lft forever preferred_lft foreverResolution
Shutdown one of the nodes with duplicate IP addresses and re-provision a fresh node with a unique IP address for the SLO. Make sure that the unique IP address is non-responsive to ensure it is not allocated or assigned to any other endpoint on the SLO network.
Site node tunnels to RE are unhealthy
Nodes establish tunnels toward F5 Distributed Cloud Regional Edges (REs) for control plane connectivity as well as the data plane necessary when publishing applications toward the Internet using F5 Distributed Cloud anycast network.
Symptom
If no connectivity to the Internet, the Distributed Cloud Console UI displays that the tunnel status is Down.

Figure: Site connectivity down in UI
Alternatively, you can check the tunnel's status and IP addresses using the Site CLI shell command status ver.
>>>status ver
[…]siteTunnelStatus:    siteTunnelStatus:    - ikeTunnelFlapReason: {}      isLocal: true      remoteAddress: 5.182.214.240      role: TUNNEL_INITIATOR      state: TUNNEL_DOWN      url: ny8-nyc.int.volterra.us      verNodeName: node-1e534[…]
Additionally, the RE endpoints may not be reachable by the CE nodes.
$$$$$$\  $$\   $$\                $$$$$$\  $$\       $$$$$$\$$  __$$\ \__|  $$ |              $$  __$$\ $$ |      \_$$  _|$$ /  \__|$$\ $$$$$$\    $$$$$$\  $$ /  \__|$$ |        $$ |\$$$$$$\  $$ |\_$$  _|  $$  __$$\ $$ |      $$ |        $$ | \____$$\ $$ |  $$ |    $$$$$$$$ |$$ |      $$ |        $$ |$$\   $$ |$$ |  $$ |$$\ $$   ____|$$ |  $$\ $$ |        $$ |\$$$$$$  |$$ |  \$$$$  |\$$$$$$$\ \$$$$$$  |$$$$$$$$\ $$$$$$\ \______/ \__|   \____/  \_______| \______/ \________|\______|WELCOME IN SITE CLIThis allows to:- configure registration information- factory reset of the Node- collect debug information for supportUse TAB to select various options.
>>> execcli ping 5.182.214.240PING 5.182.214.240 (5.182.214.240) 56(84) bytes of data.
--- 5.182.214.240 ping statistics ---8 packets transmitted, 0 received, 100% packet loss, time 8196ms
>>> ping 8.8.8.8
--- 8.8.8.8 ping statistics ---5 packets transmitted, 5 packets received, 0% packet lossround-trip min/avg/max/stddev = 9.51202ms/9.559214ms/9.682389ms/62.34µs
Resolution
Check if the local network has a blocked port UDP 4500 preventing IPsec tunnels or port TCP 443 when SSL tunnels are chosen during site creation. By default, there is an automatic fallback mechanism that changes the encryption from IPsec to SSL if not configured. The tunneling method is chosen explicitly during the site creation workflow. Adjust your network firewall to open appropriate ports or RE IP addresses.
Verify the CE node(s) can access the public IP addresses at Firewall and Proxy Server Allowlist Reference.
Disk performance metrics
Check disk performance metrics for each CE node.
The collect-database-stats command
The collect-database-stats command is a Site CLI Command tool in Distributed Cloud Console. You run it from your CE Site's dashboard under the Tools tab. It checks the health of etcd on a CE node by gathering file descriptor usage, network connections, disk usage, and running a disk performance benchmark. Use it when you suspect etcd issues caused by disk slowness or resource exhaustion.
| Check | Description |
|---|---|
| Open file descriptor limit (ulimit -n) | The maximum number of files etcd is allowed to open. |
| Open FD count for etcd | How many file descriptors etcd is currently using. |
| etcd connection count (ss) | Number of active network connections to/from etcd. |
| Open files list (lsof) | First 20 open files and sockets held by etcd (if lsof is installed). |
| Directory listing of /var/lib/etcd | Files and sizes inside the etcd data directory. |
| Disk usage on /var/lib/etcd | How much disk space the etcd data directory is consuming. |
| fio disk performance test | Measures disk write latency to detect slow storage (only runs if fio is installed). |
| etcd-member service status | Whether the etcd-member systemd unit is running, failed, and more. |
Note the following:
- fio required for disk test: If fio is not installed on the node, the disk benchmark is skipped. The rest of the diagnostics still run.
- VM mode only: This command runs on the host (
runInVM), not inside a container. - Access level: Available with
userApiunder thesystemTroubleshootGroup. - Temporary files: The fio test writes to
/tmp/test-dataand removes it when done. No permanent disk changes are made. - If fio is not installed on the node, the test is skipped and a message is printed instead.
Measure disk performance
The collect-database-stats command includes a built-in disk benchmark using fio. This test simulates the write pattern that etcd uses in production:
- Random 4K writes with fdatasync: etcd writes small data blocks and calls fdatasync to flush them to disk.
- 15-second runtime using a 250 MB temporary file in
/tmp/test-data, which is automatically cleaned up after the test. - Single job (numjobs=1) to measure raw disk latency without parallelism.
To run the collect-database-stats command:
- In Distributed Cloud Console, go to your CE Site's dashboard.
- Select the Tools tab, and then Select Site CLI Command from the Select Tool list.
- Select the node you want to test from the Active Node list.
- Select collect-database-stats from the Command list.
- Select Run.
Examine the output
In the fio output, find the sync percentiles section and check the 99th percentile (p99) latency.
For a healthy disk, the p99 value must be less than 10 ms.
If the p99 value is greater than 10 ms, the disk is too slow for etcd. etcd may experience leader election timeouts, slow writes, or cluster instability.
See example output:
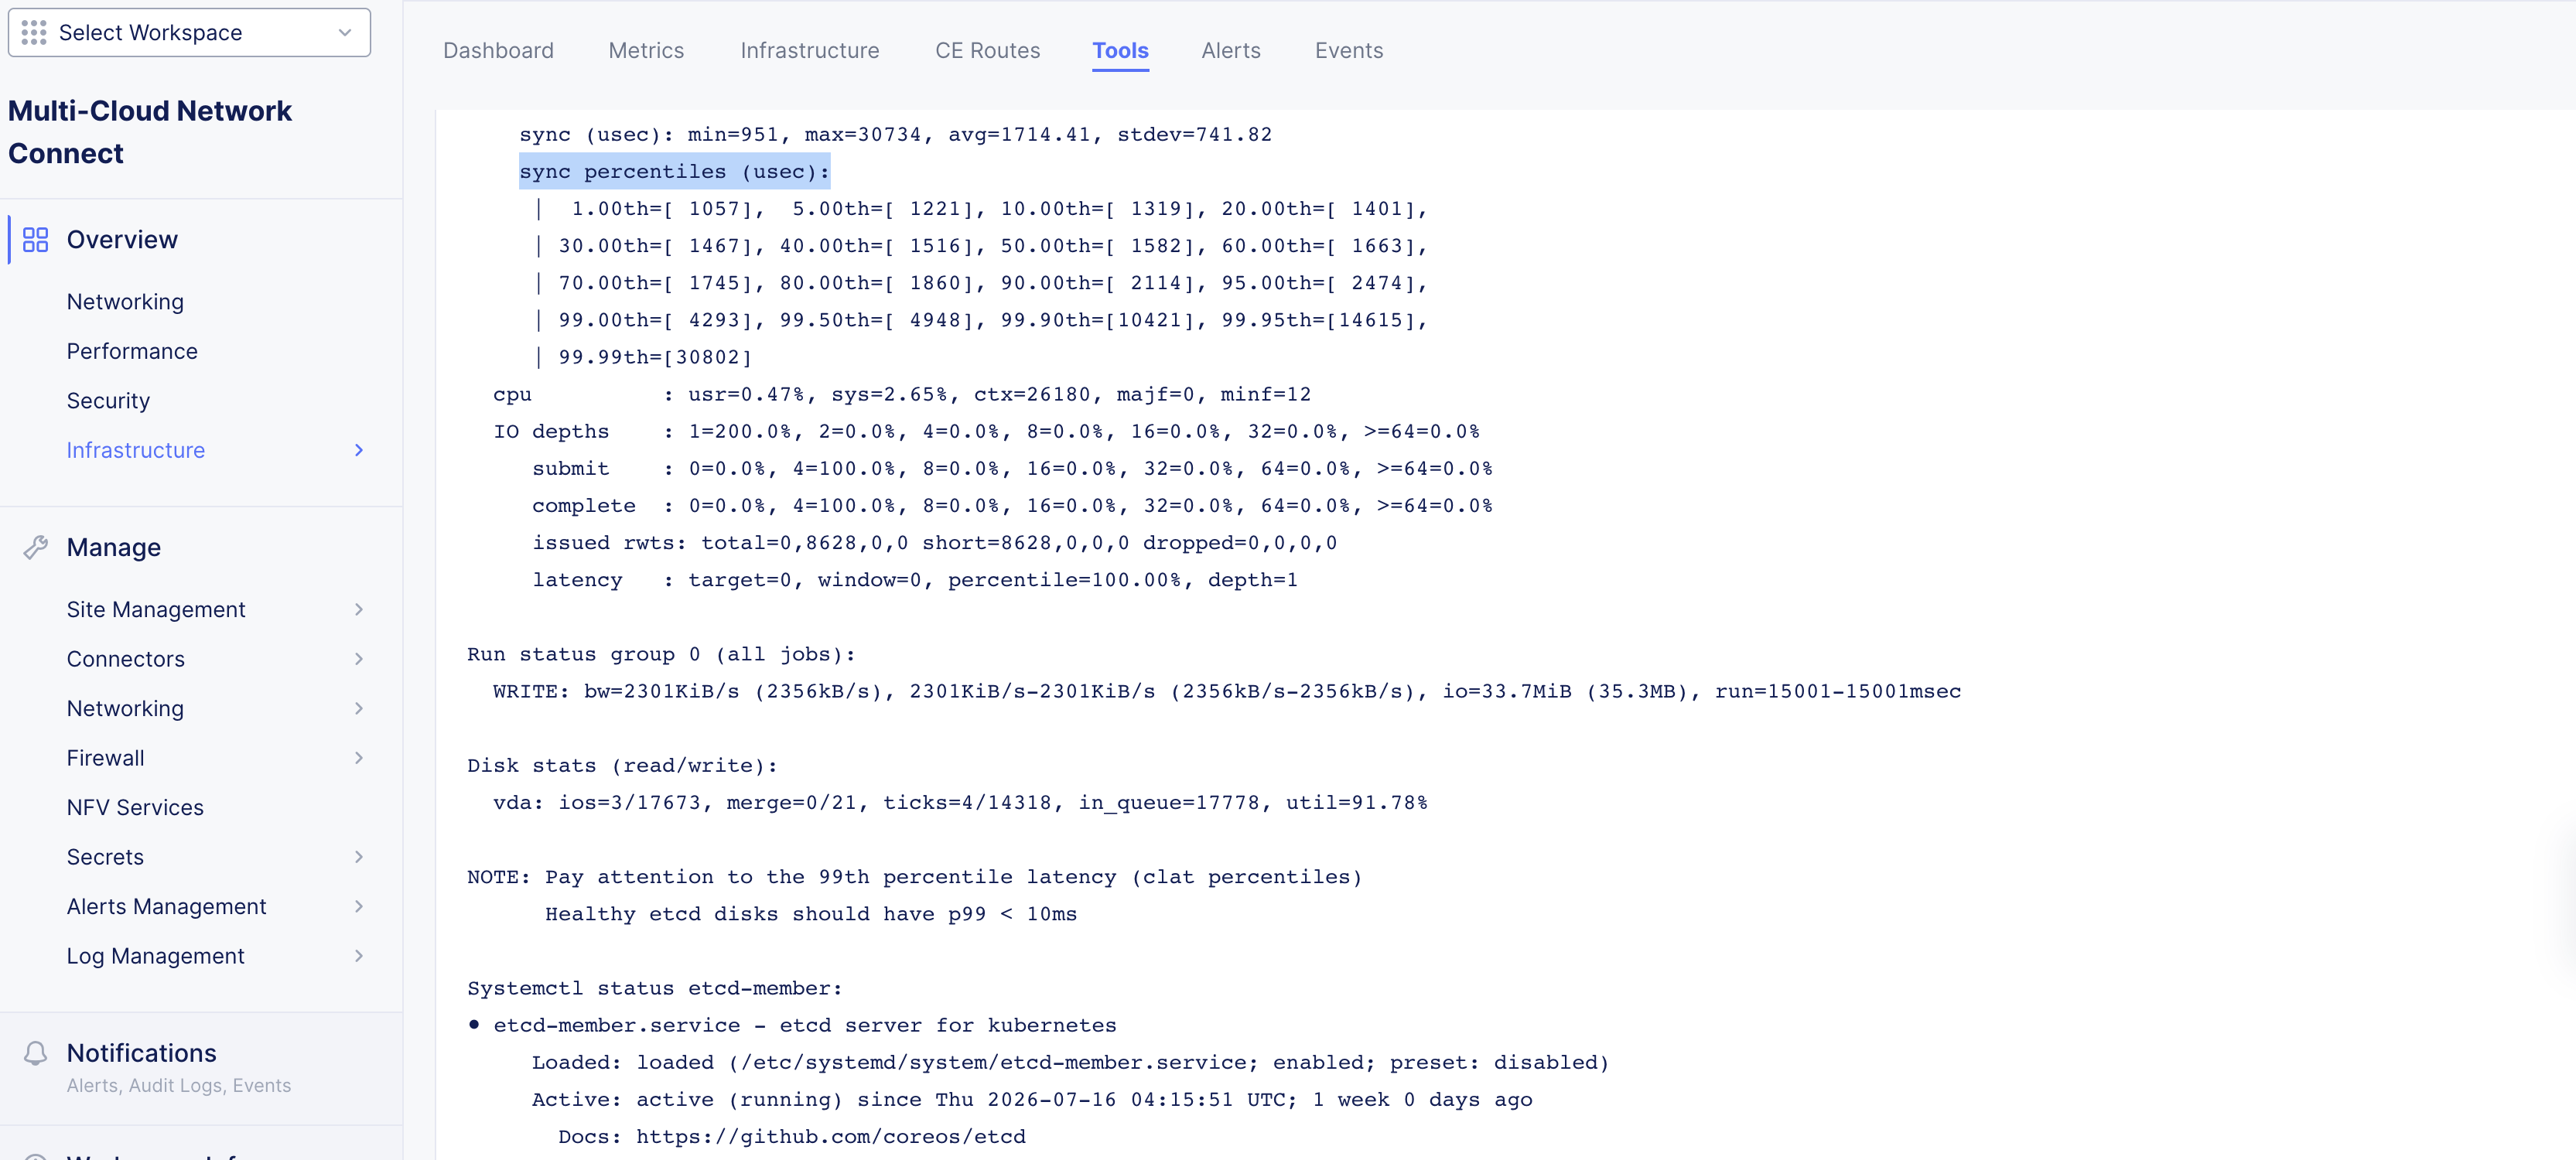
Figure: Command output
Pre-deployment and deployment verification checklist
Verify the following:
-
Benchmark sequential IOPS with fio (not the cloud-published concurrent IOPS). Target 500 or more sequential IOPS for production CE deployments.
-
Use SSD-backed storage. Avoid shared or oversubscribed data stores and burst-credit-limited cloud disks (for example, Microsoft Azure disks that throttle after credit depletion).
-
Keep multi-node CE members on a low-latency network (single L2, same DC, or same host cluster). Confirm etcd peer RTT p99 is less than 10 ms. For single-node CEs, make sure the control plane tunnel is stable (no OpenVPN flapping). This is the Mode-2 failure path.
-
Monitor the following metrics. Rising values are an early warning of CE degradation. Cross-check against etcd logs for slow fdatasync (disk) and slow network or read index response (network) warnings:
- etcd_disk_wal_fsync_duration_seconds
- etcd_disk_backend_commit_duration_seconds
- etcd_network_peer_round_trip_time_seconds
- etcd_server_leader_changes_seen_total
- etcd_server_proposals_failed_total
On this page:
- Overview
- About the Secure Mesh Site v2
- Before you begin
- Troubleshooting tools for registration and provisioning
- Site dashboard tools
- Node Site CLI tools
- Observe node VPM status and logs
- Check VPM status
- Observe VPM logs
- Common registration failure scenarios during deployment
- Node provisioning user input (cloud-init or VM scripts)
- Invalid token presented by node during authentication and registration
- Node network connectivity issues
- Node network connectivity issues toward public F5 site registration endpoint
- Not enough CPU or memory resources allocated to node
- Connectivity to public image repositories (gcr.io) for node provisioning
- Common site provision failure scenarios during deployment
- Node hostname duplication issue
- Nodes with duplicate IP addresses
- Site node tunnels to RE are unhealthy
- Disk performance metrics
- The collect-database-stats command
- Measure disk performance
- Examine the output
- Pre-deployment and deployment verification checklist